Antonio Rivero, EcosimPro/PROOSIS
In EcosimPro the Monitor its intuitive interface lets users interact with the simulations and view the data by means of charts, graphs, lists, files of results, etc.
However, to be able to make the most of all these capabilities in the Monitor, it needs an itemized work list that starts closing the model mathematically to then define the execution scenarios, i.e., to establish the initial conditions of the model, state the type of run and the integration algorithms, etc., which, for regular users of EcosimPro is known as generating partitions (endowing the model with causality) and creating EL experiments.
When the user sets out to do complex analyses, these partitions and experiments are the ideal way to work in EcosimPro, but in simpler cases, or at the beginning of building a model, it is helpful to have an agile, quick and visual way to simulate it from the model itself, so that, for instance, it is easy to understand the dynamics of the processes being modeled or to adjust the parameters of the components.
In future EcosimPro versions the will be the capacity of doing “direct” simulation.
What is Simulation from Schematics?
This is the name given to the new capability of EcosimPro software to execute simulations from schematics without having to create partitions or experiments.
For that reason, starting from a schematic, the user need only initialize the values he deems suitable for the simulation, add viewing controls for variables and define the running conditions: time, communication interval, etc.
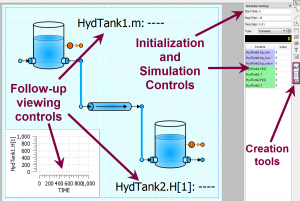
The figure shows the difference clearly:
- The initialization controls of the initial conditions of the model
- The follow-up viewing controls of the variables in the model
- The controls defining the running scenario: starting time, ending time, CINT, etc.
How to simulate from schematic?
The process is as simple as activating the simulation view and pressing PLAY on the simulation bar. In other words, it is only two mouse clicks away.

Of course, in cases requiring it, these default conditions can be modified by dialogs and setup systems.
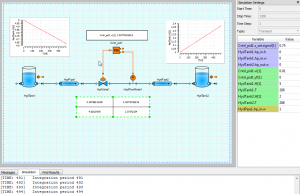
The end result is a schematic in which the viewing controls are updated during the simulation:
What Simulation of Schematics does?
There are many advantages to this new tool, mainly:
- The chance to associate physical or logical concepts represented on the schematic with the mathematic variables of the model and the results from the simulation.
- Being able to group together data so as to organize information on the basis of user criteria (order, location, ease of use, etc.)
- The capacity for synthesis permitted by the graphs and monitoring tags, by displaying only values that are considered relevant
- The improved spread and presentation of the results to third parties, who can use the relations between graphic and variable elements to better understand the models and their results.
In short, the new tool will give the end user many different possibilities for interaction, presentation and handling of data from a schematic diagram. The tool makes it possible to customize the simulations and their presentation.
Moreover, it is a platform on which even more enhancements can be added in the future, such as animated schematics in which for instance the elements on the drawing interact with the variables (tank levels that rise and fall, alarms lighting up, etc.).