Antonio Rivero. EcosimPro Development Team
Graphic modelling is the capability of representing a model by visual means; however, beyond this formal definition, its usefulness for end users is twofold: it facilitates the construction of models and provides a better understanding of the finished models.
But, how does graphic modelling work in EcosimPro? What tools are available? What are the concepts that define it? We will now try and provide answers to all these questions
The EcosimPro/PROOSIS graphic editor
The design of graphics in EcosimPro is done with a vector editor for 2D graphics that has been entirely developed by the Empresarios Agrupados team.
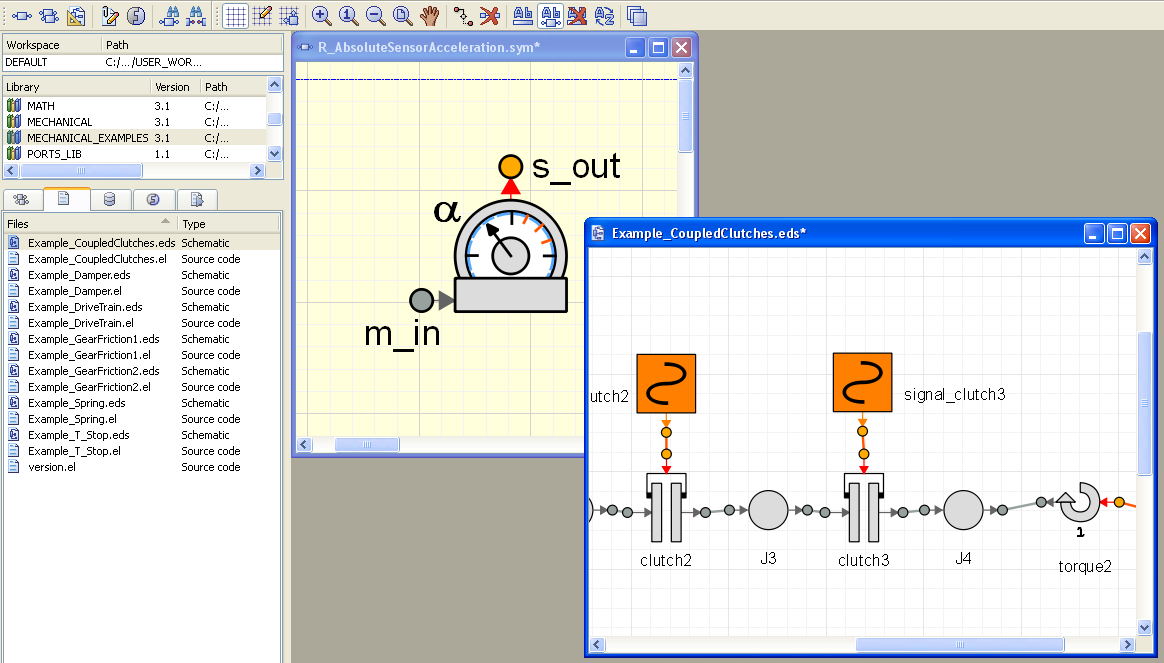 Fig. Aspect of the current EcosimPro graphics editor
The improvements since the first versions have been substantial in aspects such as management, the final quality of the graphics, the simplicity of the operations, etc. This evolution is ongoing, and new improvements and capabilities have been added in each version.
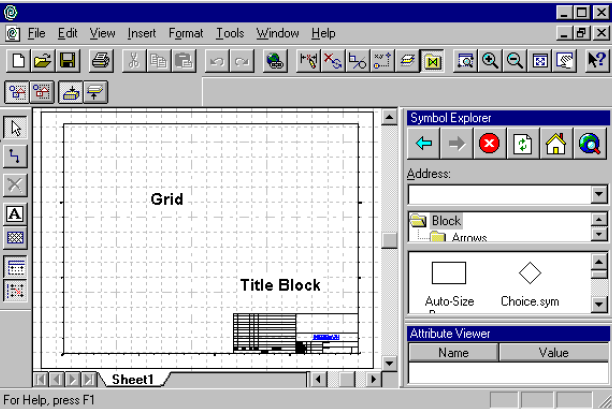
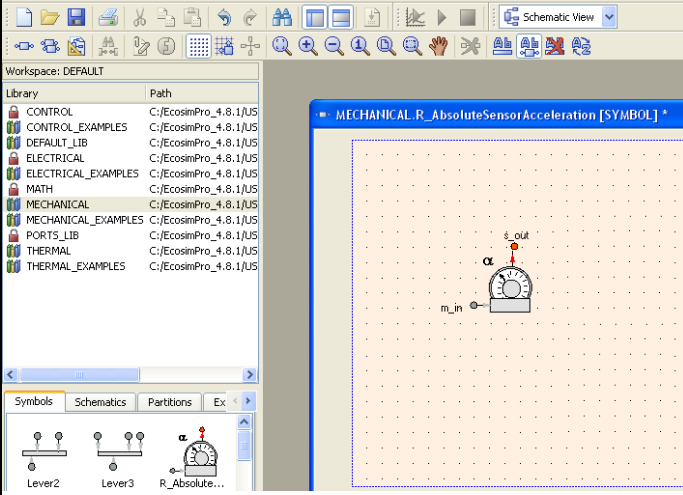
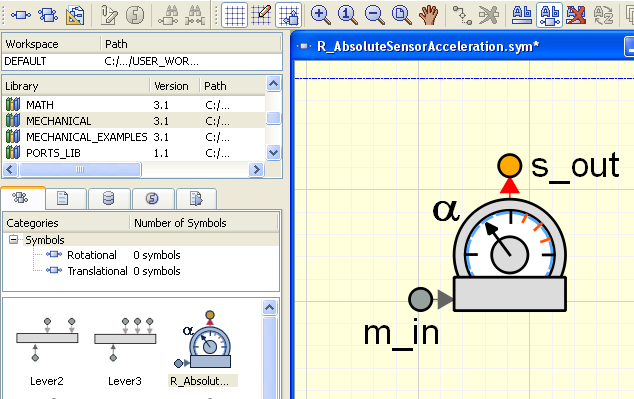
Fig. Evolution of the graphics editor (left to right): SmartSketch from Intergraph(year 2000), EcosimPro 4 (year 2004) and the current EcosimPro 5 (year 2011)
The ultimate goal is to create graphical representations of models based on simple geometric figures such as straight lines, curves, polygons, ellipses, etc. The geometry, outline and colour of all these figures will be editable.
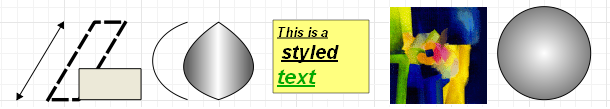
Fig. Different figures, texts and images created with the editor
Like any modern graphics editor, it has features that improve the display and printing of the graphics, the general management of the elements, such as grids for the distribution of the graphical elements, printing margins, dialog boxes to edit the styles, management of the elements in layers, etc.
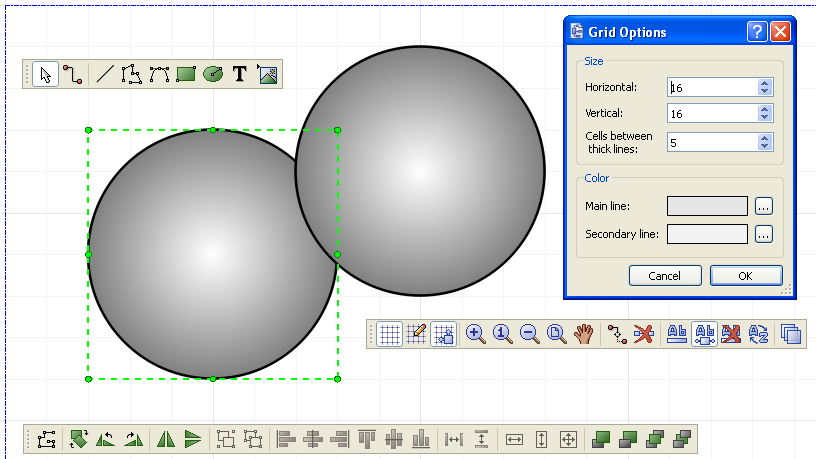 Fig. Elements of the editor: grid, control points, zoom, etc
Below are the two essential aspects for which the editor was conceived: the creation of symbols and schematic diagrams.
Symbols
EcosimPro is an object-oriented modelling tool. Thus, the modelling is based on establishing what parts form a system and then, within these parts, knowing the physical and mathematical behaviour that regulates them.
In EcosimPro jargon, analysing this ‘individual’ behaviour of the subsystems and describing it in equations with the EL language is known as creating a component.
Graphics modelling goes beyond the level of language because it is possible to create a representative symbol of a component and thus transfer the ‘mathematical’ level of the EL component to a ‘visual’ representation that is closer to the real system. This has certain clear advantages, such as understanding, reuse, etc.
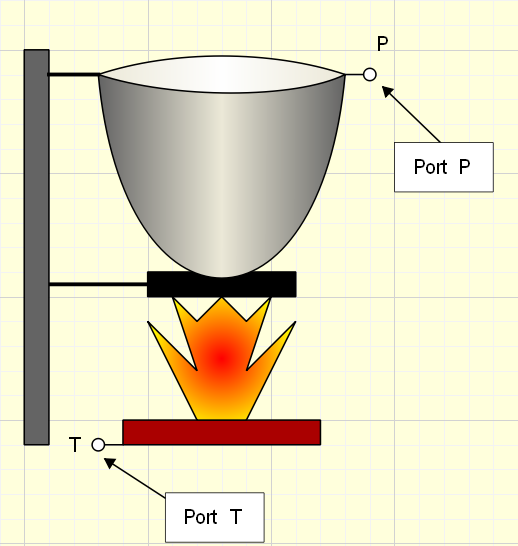
Fig. A new symbol with its graphics and ports
All these symbols are stored in the libraries with the rest of the EcosimPro structures. A palette of reusable symbols therefore becomes available.
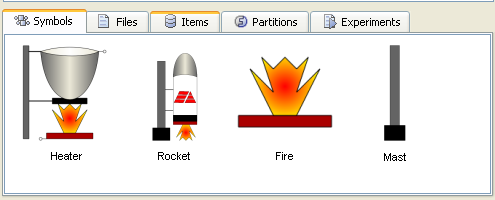 Fig. Symbols palette of a library
Therefore, the symbols are the graphical representation of the components and the starting point of any modelling based on the connection of components.
Schematic diagrams
Once the symbols are completed, graphically creating new models is as easy as clicking and dragging to a new model that is known as a schematic diagram in EcosimPro.
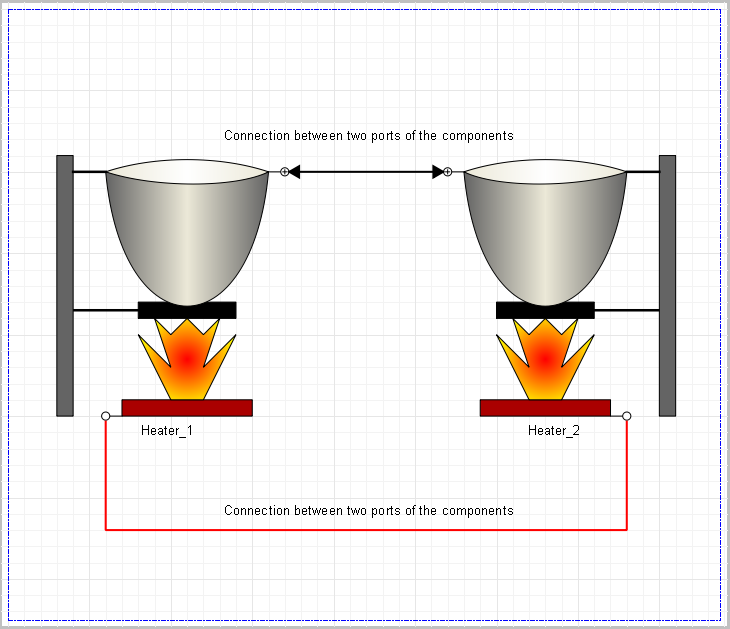
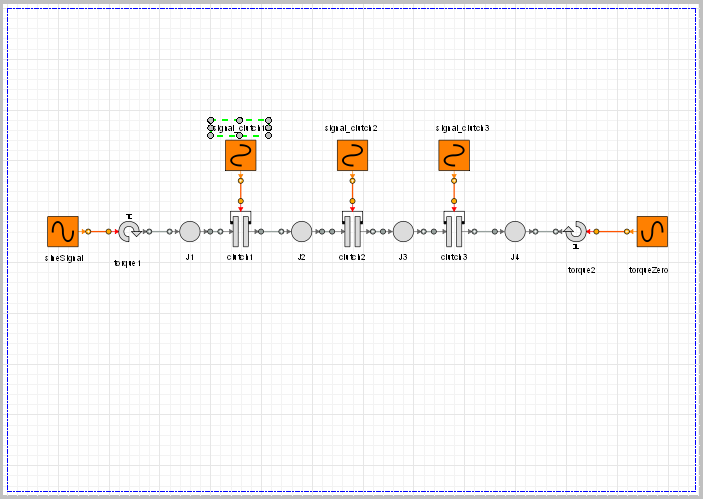
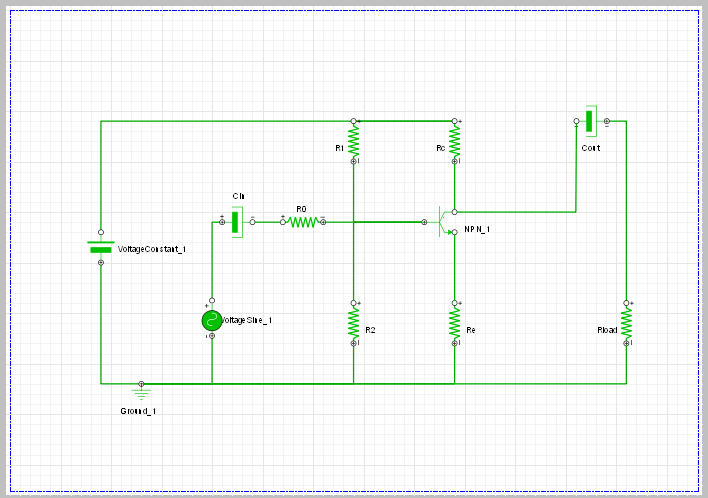 Fig. Several schematic diagrams
The end result is a new component that is the topological interconnection of other simpler subsystems.
In the next versions of the newsletter will present other graphics capabilities of the tool.